Have you noticed that, at least in the summer, the temperature in the city can easily turn out to be hotter and humid ? Why is it that the city has the feeling of being more affected by heat waves than in the countryside or in the woods? Here’s what some researchers found:

The causes of this phenomenon are to be attributed to the physical difference: usually, large urban centers do not have many trees while the countryside is normally equipped with vegetation. Precisely these two elements would represent the fundamental key to the answer to our question. These are characteristics that have been well known for years: as reported in a scientific study published on the Sciencedirect platform in 2013 , in fact, the “temperature difference between an urban space and the surrounding non-urban space is called the urban heat island effect ( UHI ). L’Global Earth Evapotranspiration (ET) can consume 1.4803 × 10 23 joules (J) of energy per year, which is about 21.74% of the total solar energy available in the upper atmosphere, while the annual consumption of human energy is 4.935 × 10 20J, about 0.33% of the annual ET energy consumption. ET vegetation has great potential to reduce urban and global temperatures . Our literature review suggests that vegetation and urban agricultural ET can reduce urban temperatures by 0.5 to 4.0 ° C. Green roofs (including urban agriculture) and water bodies have also proven to be effective ways to reduce urban temperatures “- observed the scientists in the scientific study which, in its abstract, concluded:
“The cooling effects on ambient temperature and roof surface temperature can be 0.24-4.0 ° C and 0.8-60.0 ° C, respectively. The temperature of a water body (including aquaculture urban) can be below the temperature of the surrounding built-up environment between 2 and 6 ° C and a water body with an area of 16 m 2 can cool up to 2 826 m 3 of nearby space by 1 ° C. Based on these results, it can be concluded that the increase in evapotranspiration in cities, derived from vegetation, urban agriculture and the water body, can effectively mitigate the effect of urban heat islands “ – concluded the scientists.Similar findings were also found by another research group through a study published in2018 :

range of NDVI values 0.1-0.2 was 333.04 km 2. 1471.1 km 2 was identified as the NDVI value between 0.3-0.4 and the low temperature area was 1529 km 2 where temperature below 25 o C. Based on these results, it is possible to see very clearly the high temperature in the non-vegetated areas and the low temperature in the vegetated areas. This is probably due to the ecological function of the vegetation which determines the surface temperature from the high evapotranspiration. The vegetated areas are mostly measured with the surface temperature. Therefore, the research findings can be useful for policy makers and planners of development projects such as the Western Province Megapolis project, as well as for the general public to understand the effects of– concluded the authors of the study. Confirmation also from the European Space Agency :
“With air temperatures above 10 ° C above the time-of-year average in parts of Europe , the United States and Asia , June 2022 set a new record. The fear is that these early-season extreme heatwaves are a foretaste of what may soon become the norm as climate change continues to take hold. For those in cities, heat dissipates more slowly creating ” urban heat islands “. make everyday life even more tiring.For ESA, this particular instrument, called ECOSTRESS and owned by NASA’s Jet Propulsion Laboratory (JPL), is important because it is helping in the development of a new Copernicus Sentinel satellite: the Land Surface Temperature Monitoring (LSTM) mission. ESA is using the tool to simulate the data that will eventually be returned by LSTM, which will provide systematic measurements of the Earth’s surface temperature, promising to be a game changer for urban planners and farmers, for example. Both space agencies are working closely together to make the most of the two missions synergistically, including JPL’s Surface Biology and Geology mission.Indeed, this collaboration is part of the overall goal of working together to drive a response to climate change:
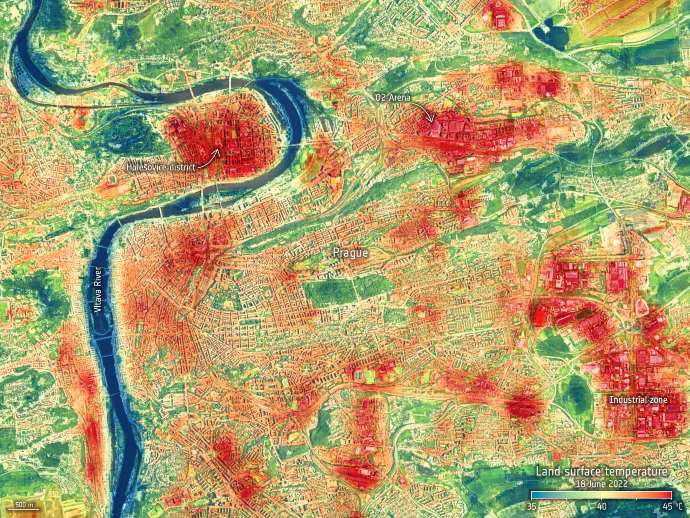
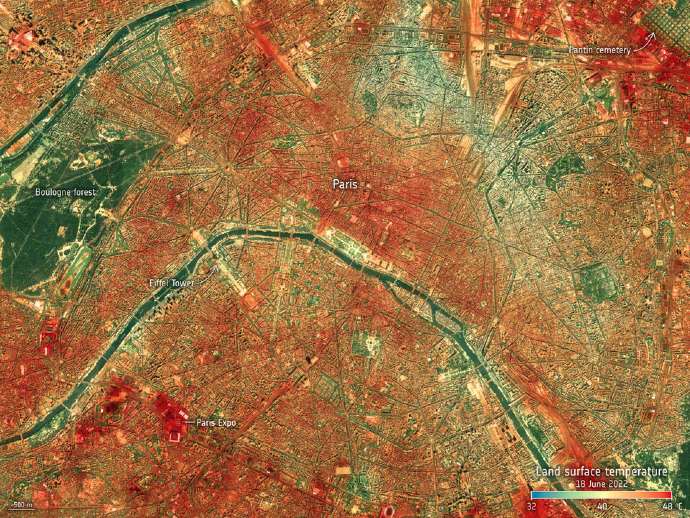
the NASA-ESA Framework Agreement for a Strategic Partnership in Earth System Science, which was recently signed. The world has already warmed about 1.1 ° C since the start of the industrial age, and temperatures will continue to rise unless greenhouse gas emissions are drastically reduced. Heat waves appear to increase in frequency, intensity and duration due to human-induced climate change. June was a stark reminder of what’s in store. For several consecutive days in mid-June, many European cities endured air temperatures above 40 ° C. Europe was not alone in suffering this June. Tokyo, Japan recorded air temperatures above 35 ° C for five consecutive days, making it the worst heat spell recorded in June since logging began in 1875. In the United States, by June 15, nearly a third of the population was under some form of heat warning. The city images here show Earth’s surface temperatures in Milan, Paris, and Prague on June 18 in the early afternoon. For comparison, the broader view of Earth’s surface temperature across much of Europe below was taken by the Copernicus Sentinel-3 mission on June 18, slightly earlier in the day.
The difference, however, is not really about the time of day the image was captured, but the importance of the difference in resolution. The ECOSTRESS images offer much more detail than those of Sentinel-3 and it is this level of detail that will be achieved by the new Copernicus LSTM mission, increasing the spatial resolution by a factor of 400. It is worth noting the difference between the air temperature and the temperature of the earth’s surface. The air temperature, shown in our daily weather forecast, is a measure of how hot the air is above the ground. The temperature of the Earth’s surface, on the other hand, is a measure of how hot the actual surface would feel to the touch. Scientists monitor the temperature of the Earth’s surface because the heat rising from the Earth’s surface affects weather and climate patterns. These measurements are also particularly important for farmers assessing how much water their crops need and for urban planners seeking, for example, to improve heat mitigation strategies. Extreme heat can be fatal. Urban dwellers are particularly susceptible to the urban heat island effect, which increases heat compared to countryside where there is more vegetation. Urban heat islands occur when natural ground cover, such as vegetation, is replaced by dense concentrations of pavement, buildings, and other surfaces that absorb and retain heat.Glynn Hulley , of the JPL, said:
“ECOSTRESS continues to imagine the impact of extreme heat in cities around the world, including recent heatwaves that have broken records in both Europe and the United States. This data can be used to identify hotspots, vulnerable regions and evaluate the cooling impact of heat mitigation approaches “. Benjamin KoetzESA said: “The tool is proving extremely valuable in helping us develop and prepare the European LSTM mission, which will offer data on the Earth’s surface temperature with a similar resolution of 50m. “The launch, planned towards the end of the decade, the main objective of LSTM is to respond to the needs of European farmers to make agricultural production more sustainable as water scarcity increases, thus helping farmers to achieve more” gathered for the drop ‘. “However, it is clear that we are all experiencing more heatwaves and LSTM will also be important to help authorities address the serious problem of urban heat islands by monitoring the microclimates of cities” – conclude from ESA. In this regard, we report below the link to a video spread on the web that explains the concept of ET:
Sources:
https://www.esa.int/Applications/Observing_the_Earth/Copernicus/City_heat_extremes
https://www.sciencedirect.com/science/article/pii/S2095311913605432


